This website is
devoted to the display of information about the
Bible using diagrams and charts.
The main
index page is here: Diagrams
|
|
| |
|
AN IMPORTANT NOTE
TO VISITORS:
There are at least two different ways of viewing
the scriptures, and biblediagrams.com attempts to
satisfy both:
- Fundamentalist
- everything in the Bible is true.
- When
diagramming scripture, show as
accurately as possible what the
text says (e.g Genesis ch 1-10).
- Indicate
where scriptures place
themselves, people and events, in
time and space (using the tag
"tradition", or
"setting").
- Scholarly - a
historical / critical approach to the
text. This is largely the work of
analysts who started in the 19th
century.
- Books
of the Bible are given dates and
origins in accord with textual
and archeological analysis
(identified with the tag "final form")
- The Documentary
Hypothesis, which
considers Torah/Pentateuch
consisting of four sources, JEPD,
with subsequent editing by a Redactor, is
presented here.
- For
the New Testament, non-canonical
gospels are shown (Gospel of
Peter, Gospel of Thomas, et al)
with placement in time according
to different scholars (Brown,
Crossan).
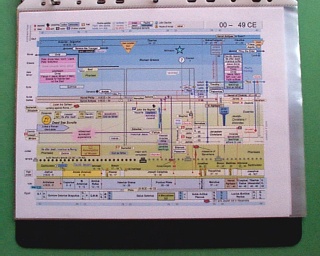
About the timeline:
- The earlier
periods diagrammed (before the year 1000
BCE - from Exodus to Samuel) represent a
fusion between fundamentalist and
historical perspectives.
- Most
scholarly assessments categorize
the early books of the Hebrew
Bible as legend.
- Fundamentalists
consider them to be real history.
- The
diagrams found here for that
period are something of a
compromise: Include the
personages, but scale back the
timespans, typically years
reigned, so that they better
match other historical records
(e.g. those from Egypt). This is
done for the patriarchs and
judges. You might call it
"modified
fundamentalist".
- The earliest
period (before the year 1500 BCE - which
is mostly Genesis), does not allow for an
easy fit when using the timespans
recorded in the Bible - because the
50-year-at-a-time diagrams would be
mostly blank except for lines indicating
which patriarchs (Adam to Abraham) were
living at the time. Instead the
personages are organized into a Nations
Schematic, to show the relationships, but
without dates.
It
is not the purpose of this website to promote a
point of view. This website is dedicated
to presenting, in as clear a fashion as possible,
what the Bible says, what fundamentalists
believe, but also how historians and scholars
view the scriptures. This website attempts to be
inclusive, and to be a resource for as many
people as possible.
Author's note: It
is a major challenge to present material that
does not offend one group or another. Not only is
there the division between the traditionalist and
non-traditionalist, but among the historians
there are competing viewpoints as to the dating
or historicity of events. This website tries to
include as many perspectives as possible so that
they can be compared with each other; no
viewpoint should be considered to be preferred in
the diagrams.
REPRODUCTION: Diagrams may be printed
and used for personal and limited distribution
(under 20) only; copying for commercial use or
widespread distribution is prohibited except by
permission.
|
|
| |
|
Technical issues:
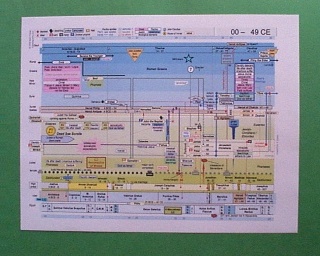
The diagrams
have been created using presentation
software. Most are familiar with Microsoft's
Powerpoint®, and we use that along
with a similar application, Sun's StarOffice® StarImpress. When a
diagram is finished, we capture the screen
and convert it to a .gif image and that's
what you see on this site.
|
|
| |
|
Coming
up:
All diagrams are being
converted, if not already in that form, into
PowerPoint® slides. This is for a product
to be introduced in the future.

PowerPoint offers the
advantage of better quality screen display,
quality print outs, and embedded links (right
now, the 2000 Year Timeline slideshow has
over 4,500 links).
All PowerPoint slides
(with the exception of the Genesis Genealogy)
are formatted with 1/2" borders for
print out and are best displayed in plastic
sheet protectors.
F Product preview page (restricted access)
Microsoft
PowerPoint® is a registered trademark of the
Microsoft Corporation.
|
|
| |
| |
|
| |
|
Sources
used fror the historical / scholarly aspects of
the diagrams:
| |
|
PRIMARY |
|
|
|
|
| |
|
The New Oxford Annotated
Bible
(NRSV) |
|
2001 |
|
Oxford
University Press |
| Boadt, Lawrence |
|
Reading the Old Testament * |
|
1984 |
|
Paulist Press |
| Carroll,
James |
|
Constantine’s Sword |
|
2001 |
|
Houghton
Mifflin |
| Crossan, John Dominic |
|
The Birth of Christianity |
|
1998 |
|
HarperSanFrancisco |
| Crossan,
John Dominic |
|
Who Killed Jesus? |
|
1996 |
|
HarperCollins |
| Friedman, Richard Elliott |
|
The Bible with Sources
Revealed |
|
2003 |
|
HarperCollins |
| Friedman,
Richard Elliott |
|
Who Wrote the Bible? |
|
1989 |
|
HarperCollins |
| Johnson, Paul |
|
A History of the Jews * |
|
1987 |
|
Harper Perennial |
| Johnson,
Paul |
|
A History of Christianity * |
|
1976 |
|
Simon
& Schuster |
| Koester, Helmut |
|
Ancient Christian Gospels |
|
1990 |
|
SCM Press |
| Küng,
Hans |
|
Christianity: Essence,
History, and Future |
|
1994 |
|
Continuum |
| Rogerson, John |
|
Chronicle of the Old
Testament Kings |
|
1999 |
|
Thames and Hudson |
| Shanks,
Hershel |
|
The Mystery and Meaning of
the Dead Sea Scrolls |
|
1998 |
|
Random
House |
| Shanks, Hershel (ed) |
|
Understanding the Dead Sea
Scrolls |
|
1993 |
|
Vintage Books |
| White,
L. Michael |
|
From Jesus to Christianity * |
|
2004 |
|
HarperCollins |
| |
|
Wikipedia |
|
|
|
Wikimedia Foundation |
| |
|
* -
recommended |
|
|
|
|
| |
|
SECONDARY |
|
|
|
|
| Asimov,
Isaac |
|
Asimov’s Guide to the
Bible (2
vols) |
|
1988 |
|
Wings
Books |
| Cantor, Norman F. |
|
The Civilization of the
Middle Ages |
|
1995 |
|
HarperPerennial |
| Gibbon,
Edward |
|
The Decline and Fall of the
Roman Empire
(abridged) |
|
1952 |
|
Viking
Press |
| Herm, Gerhard |
|
The Celts |
|
1975 |
|
St Martins |
Many of
these authors are considered liberal Christians by fundamentalists.
|
|
| |
|
Background:
The diagrams
you see here are the work of Mark Poyser who
started out in 2000 creating cartoons about
the hi-jinks in the stock market. This was a
time when the bubble was breaking, and so
there were lots of crazy things going on. The
cartoons could be seen at the website WallStreetFollies.com, and were also
included in CNN-Money's morning e-mailer, The
Eye Opener, for four years (2000 to 2003)
until it was re-formatted. In addition to
being seen in on the website, or CNN-Money's
e-mailer, selected cartoons were used or
mentioned favorably in a number of
publications:
Canada's Financial Post
(accompanying their main editorial of
9 July 2002)
Salon's Scott Rosenberg's Links
TheStreet.com
The Houston Chronicle
Grant's
and was listed as one of USAToday's
Hot Sites for September 2002
|
One
of the popular items developed at
WallStreetFollies.com was a diagram of various
relationships between major players in the
stock market, and various companies - some of
which were accused of poor accounting - or
worse.
Since then,
we've spent time developing diagrams for a
wide range of subjects. Those not related to
the Bible may be found at threetwoone.org, and include such
topics as the War of the Roses and Global
Connections
|
|
| |
|